 |
See also www.timewriter.com/support/video for instruction video's how work with reports. |
The Report designer makes it easy to create new reports, exports and grid views. All new designs are saved in the TimeWriter database and will always be available to anyone in your organisation who uses TimeWriter.
General
Creating a design
Select the required module (Reports, Exports or Grid views) in Reporting in the Module explorer.
Click on New, and the Report designer will appear.
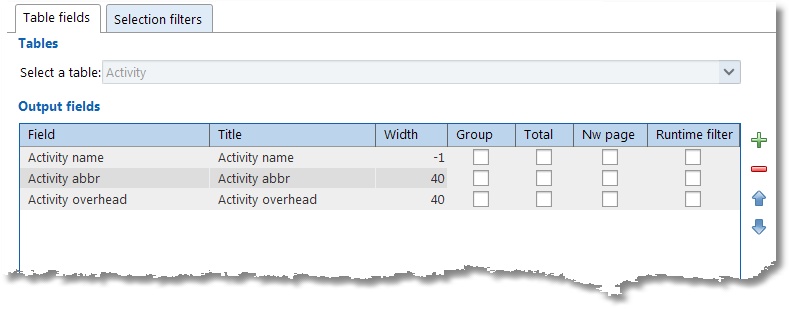
Table fields tab
| 1. | Click on the Table fields tab. This is where you determine what is to go in the columns of the report. |
| 2. | Select the data type that is to be processed in the report in Select a table. |
| 3. | Click on  to add one or more fields. Which fields are available depends on previously selected data types. Using to add one or more fields. Which fields are available depends on previously selected data types. Using  allows you to remove a selected field. allows you to remove a selected field. |
Note: You can not add, delete or move fields of custom made reports, the buttons will be disabled.
| 4. | By double clicking on a column cell, you can alter its contents: |
| • | Description of field name and field title. |
| • | Column width. ** |
| • | Group = Yes: field will be grouped; a new value results in a new subheading. N.B. The fields to be grouped MUST be located at the top of the list. ** |
| • | Total = Yes: field will be totalled; after every change to the grouped field a total for this field will be produced. ** |
| • | Nw page = Yes: Subheadings will be put on a new page. |
| • | Runtime filter = Yes: The field will be used by default in the Runtime filter. |
Note: The Group, Total, and New page options can not be set for numeric fields. In that case the options will be disabled.
| 5. | With  and and  you can move output fields. The first field will become column 1 in the report, the next one becomes column 2 and so on. you can move output fields. The first field will become column 1 in the report, the next one becomes column 2 and so on. |
| 6. | When Show detail lines when grouping is ticked, the detail lines related to the grouping will be shown in the report. |
At the bottom of the tab the total width of columns can be seen in pixels. If the maximum column width is exceeded then the line will turn red and column widths will need to be fixed. **
** Only available / visible in the designer of the reports module, not in the designer of the exports- and grid views module.
Selection filters tab
| 1. | Click on the Selection filters tab. This is where you set up what requirements the reporting details need to meet. |
| 2. | You can use Extra selection filter preset to define a selection filter in advance. When the report is selected this setting is shown in Extra selection filter. |
| 3. | The Predefined filter on content can be used to enter one or more criteria that must be met by the report selection. Click on to add a new filter rule, use to remove a selected filter rule. An existing filter rule can be changed with  . . |
Scripting tab
Scripting is only to be used by experienced users with a solid knowledge of javascript and the TimeWriter database.
1.Click on the Scripting tab.
2.By selecting Use scripting the script editor and use of scripting is activated.
3.In the script editor javascript code can be entered. This code will be executed on the query result of the report, export or grid view.
Other tabs
Report specific tabs see: Reports.
Export specific tabs see: Exports.
Grid view specific tabs see: Grid views.
Saving
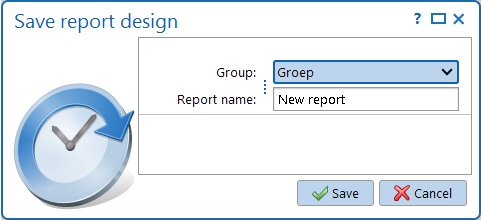
Click on  to save the design.
Changing the design
| 1. | Select the required reporting module in the Module explorer. |
| 2. | Select the correct report, export or grid view group from the list. |
| 3. | Select the required report, export or grid view from this group. |
| 4. | Click on Edit. |
| 5. | Proceed the same way as in Creating a design. You can also save a changed design under a new name via File | Save as. |
Reports
Below is an overview of report-specific settings.
Report options tab
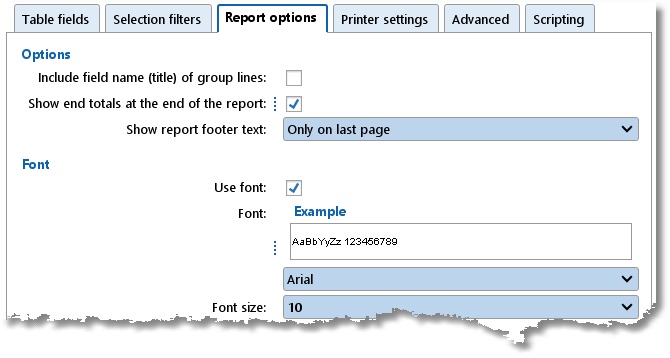
1.Click on the Report options tab. You can edit two format settings for reports here.
2.By ticking Include field name (title) of group lines the group name will also become visible in the field title together with the grouping value.
3.By ticking Show end totals at the end of the report the end totals for group fields will be shown at the end of the report.
4.With Show report footer text you can set if the report footer text will be printed only on last page, on every page or never. Default the footer text will be printed only on last page.
5.By ticking Hide company logo the company log will not be printed on the report.
6.By ticking Print in landscape the report will be printed in landscape.
7.By ticking Use font you can choose a different font and/or font size to be used for the report.
Preferably use a Recommended font from (the top part of) the list of available fonts. Using one of the other fonts can sometimes result in performance issues.
Advanced tab
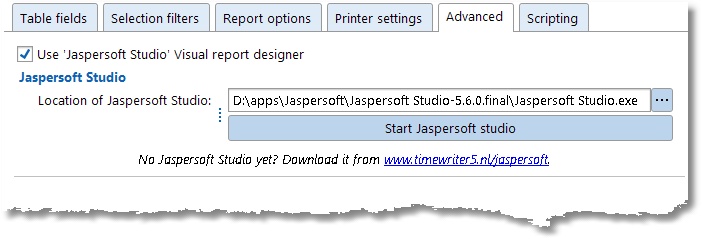
The visual report editor is only to be used by experienced users with a solid knowledge of Jaspersoft Studio and the TimeWriter database. The Jaspersoft report designer has to be installed first and can be downloaded at: www.timewriter5.nl/jaspersoft.
1.Click on the Advanded tab.
2.Select Use 'Jaspersoft Studio' Visual report designer to be able to use the visual report designer.
3.Set up the location of Jaspersoft Studio. Click on button  to search and select the program using the explorer.
4.Click on button Start Jaspersoft studio to open the visual report designer.
Exports
Below you will find an overview of export-specific settings.
Export options tab
The following options are available:
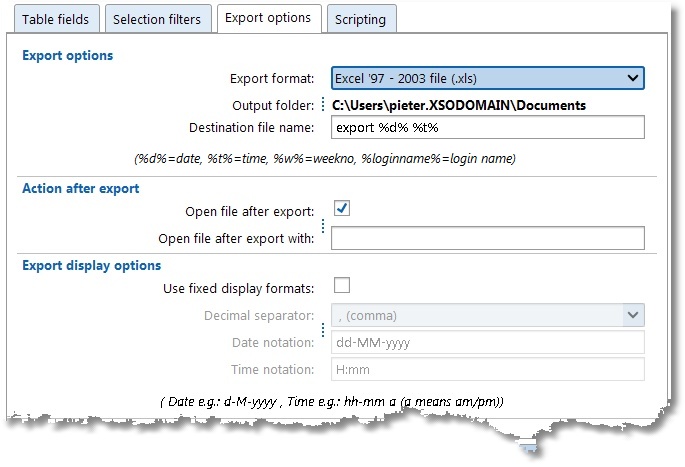
1.Export options
Indicate here which file format you want to use for exports (.csv, .txt, .xml, .xls, .xlsx or .ods ). The default output folder as set up by the Administrator is shown here. If needed, change the by TimeWriter suggested file name. If you want to you can add the complete path to the file name; the file will then be placed in this folder. Variables can be used in the file name. These variables will then be replaced by the associated values when the file is generated. The following variables are available:
%d% = actual date (year/month/day)
%t% = actual time (hours/minutes/seconds/_milliseconds)
%w% = actual week number
%loginname% = user login name
In the above example "export %d% %t%.xls" on December 4th 2014 at 14:14 hours will result in: "export 20141204 1414_809.xls".
2.Action after export
By ticking 'Open file after export' you indicate that the generated export file needs to be opened by the standard application associated with the file format. If needed, use ‘Open file after export with’ to fill in an alternative program that should open the generated report automatically. The report can then be checked straight away and edited if necessary.
3.Export display options
Standard display options are taken from the Personal settings. When ‘Use fixed display formats’ is ticked a (deviating) decimal separator and / or a (deviating) date and time display can be set up.
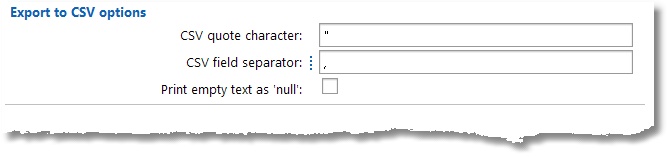
4.Exporting to CSV options
This option will only be shown if .csv is chosen in Export options. For this file format, the following can be set up: the quote character (between which field values are posted), the field delimiter and the display for empty text (as blank text or as "null").
Grid views
Below you will find an overview of grid view specific settings.
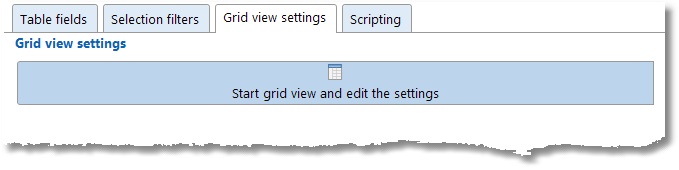
Grid view settings tab
Clicking the button ‘Start grid view and edit the settings’ on this tab, will open a screen containing three tabs:
1.Grid view
Under this tab, you can set up grouping for a grid view by dragging one or more column headings to 'Drag columns here to group’ . By clicking on a column header you can sort that column. Clicking again reverses the sorting order. If you hold down the [Ctrl] key and click on second column header, you will get sub sorting of that column.
2.Chart
Charts can be created from the grid view data. In 'Chart options', specify which field indicates the series and which field indicates the values for the chart. Please specify in ‘Chart view’ whether the default version is to be a bar chart or a pie chart by choosing the appropriate tab. A number of display options can be set for both types.
3.Pivot table
A Pivot table allows you to interactively compare data in columns against the data in rows.
By including multiple fields in a row and/or in a column you can group the data in a flexible way. You can also filter on certain data. You can extract different information from a pivot table for which you would normally need to run many reports.
On the right hand side, the available Series- and Value fields are shown. Drag these fields to the left to their destination locations. By dragging the fields you quickly build up an overview of data and keep getting different perspectives of the data. By clicking on the series fields you can sort using the associated series. It is recommended that you ‘play around’ with the pivot table. You will see how much information it can provide you with.
Next, save the settings so they are kept as default for the created display format.