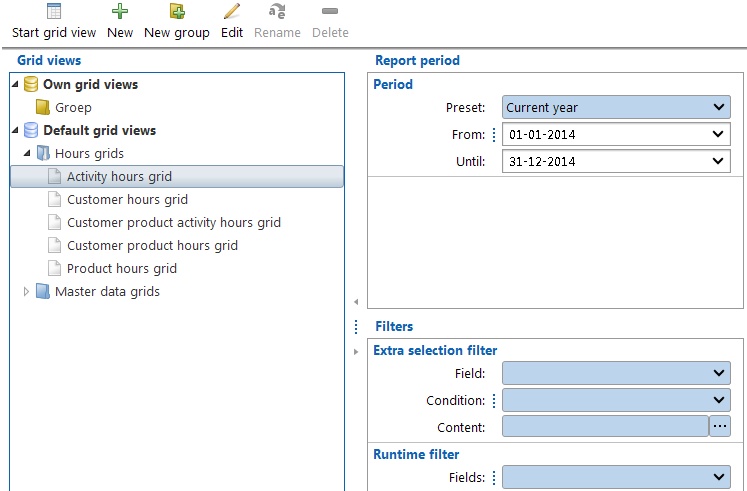
TimeWriter Professional offers various grid view formats, arranged in various groups. Select Reporting | Grid views in the Module explorer.
TimeWriter is supplied with a series of Default grid views. These are located in a separate table and cannot be customised. You can generate grid views for booked hours, master data, leave and budgets. You can use the default grid views but you can also create your own grid views as long as you are authorised to do so.
A grid view is a variant of a general report. The biggest differences are:
| • | Data is shown in a grid format. |
| • | You can interactively group and sort fields. Groups can be expanded and collapsed to show or hide data. |
| • | All numerical fields are automatically being totalled. |
| • | Easily create and change your own grid view. |
| • | The view shown on screen can also be printed (including expanded or collapsed groups). |
| • | Data can be converted into graphs. |
| • | You can arrange data in a pivot table. |
Generating a grid view
| 1. | Select the correct grid view group from the list. |
| 2. | Select a grid view from the group. |
| 3. | Enter the required time period at the right hand side (see also Selection filters). |
| 4. | Also enter any Extra and / or Runtime filters at the right hand side (see also Selection filters). |
| 5. | Double click on the grid view or click on the Start grid view button to view on screen. |
Designing and changing grid views
see Report designer.